The product layer for the materials economy.
One verified, machine-readable record per material — built from the sources the industry already trusts, normalised value by value, and served to the people and agents building on it.

Match
Point it at a room.
Show the graph a photograph and it reads the surfaces — the timber, the tile, the stone — then answers with real products from the catalog, each scored by how closely the material matches.
natural wood slat paneling
4 of the catalog’s answers

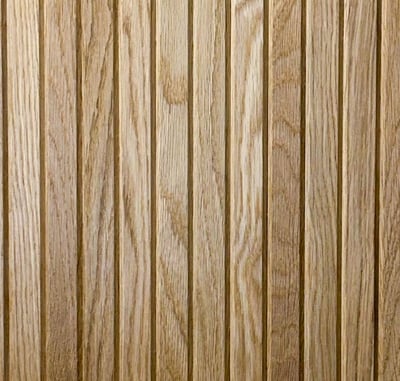

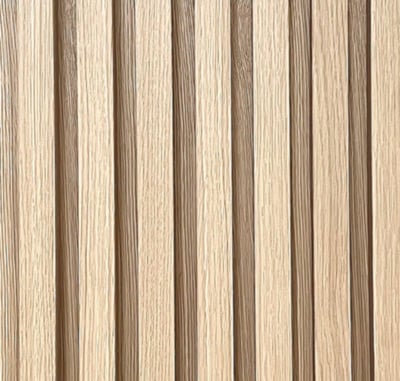
Surfaces detected and products matched by the live engine, 2026-08-06. Every card links to the public record.
See Match in full →2,519
Brands
152K
Products
446K
Variants
17M
Source-tracked values
The problem
Every material is described a hundred different ways.
A product page, a data feed, a spec sheet, a photograph — the same fact arrives spelled a little differently every time. The graph’s work is the fold: each arriving form lands on one canonical, attributed value. Different every time they arrive; identical when they land.
One material · fire rating · seven arrivals
01·The catalog
One language for every material.
A dimmer switch and a floor tile have nothing in common — except the 27 universal blocks that describe them both. 4 more activate by product type. The schema is universal. Only the composition changes.
What the product is. The physical facts that don't change with context.
What the product does. Measurable characteristics that determine where it can be specified.
How to get and use it. Everything needed to actually specify, order, and install.
Verified
Every value keeps its receipts.
A value is only worth as much as the source behind it. Each one carries where it came from, how confident the graph is, and every change it has ever seen — so you can trust it, or challenge it, on the evidence.
Sourced
Records begin as structured data from the corpora the industry already trusts, then agents extend them from spec sheets and product pages. Every value lands with its source attached.
Normalised
Spellings collapse to canonical terms, free text to typed values, sizes to canonical units. What can't be verified stays visibly unknown — the graph never guesses. Folding fire-rating spellings alone took the same question from 12,484 answerable materials to 66,634, across six times the brands.
Served
One record, many readers: cross-brand spec queries, colour and visual search for people, and typed contracts for the agents building on top.
02·Living truth
The graph keeps itself current.
A feed is a snapshot; the graph is alive. 31 block specialists check it against a brand’s own site and spec sheets — catching drift, new and removed products, and figures that have gone stale, filling the gaps the feeds leave open, and finding products no feed carries yet. Point one at a URL and it returns a graph-backed record.
Agents propose; people gate. When a checked value disagrees with the record, the disagreement becomes a review — the record is never silently edited.
03·Visual understanding
The graph sees the material.
Every record carries what the material looks like— a 2048-dimension visual embedding of its imagery, an extracted palette, and a colour language of family, mood, and undertone. Ask in appearance words, a paint name, a mood, or a specification — the answers below are real, run against the live corpus. Colour is derived from product imagery, never manufacturer-declared.
24 colour terms · 3 vocabularies · 19 moods
Baked from a live run · each cell is a matched material’s extracted colour
04·The agentic surface
Built to be read by machines.
The materials economy is about to be read mostly by machines, so the graph treats agents as first-class readers — structured values, attribution, freshness, and explicit missingness, instead of scraping and guessing.
A material that isn’t on the record is invisible to the agents that will increasingly do the specifying.
Material Desk — a different product — runs on the published SDK, and a query’s answer can leave as a schedule spreadsheet or a Revit specification package.
Explore the developer surface →MCP tools
49 read tools — typed find-by-spec, facets, colour, and schema queries with structured output.
A2A agent card
Other parties’ agents discover the graph and delegate tasks to it.
OpenAPI REST
The same query primitive over plain, versioned REST.
llms.txt
LLM-oriented summaries of the schema, blocks, and endpoints.
CLI parity
Everything an agent can do, scriptable from a terminal.
JSON-LD export
Records that join directly to schema.org and industry standards.
It knows the rules.
Materials read against model building code as adopted, jurisdiction by jurisdiction — advice with its citation, never a determination.
Codes →It knows what’s substantiated.
Sustainability claims with per-claim verdicts, never summed — and an assertion without evidence is a different finding from a question never asked.
Sustainability claims →05·Demand & intent
The graph knows what gets specified together.
Co-specification edges computed from 36 months of real project activity — which materials are sampled together, considered together on boards, and how strongly, expressed as lift against chance. Joined to the variant graph, that unlocks pairing suggestions, palette companions, and demand momentum no spec sheet contains.
See what gets specified together →Gray is ceding share.
recent four quarters vs the four before
23,496,595
Spec lines observed
211,816
Materials tracked
One graph. Ask it.
Every material on this page was read by a model. 362,014 images. $84.